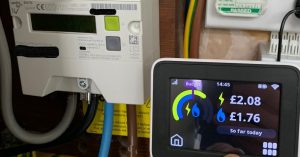
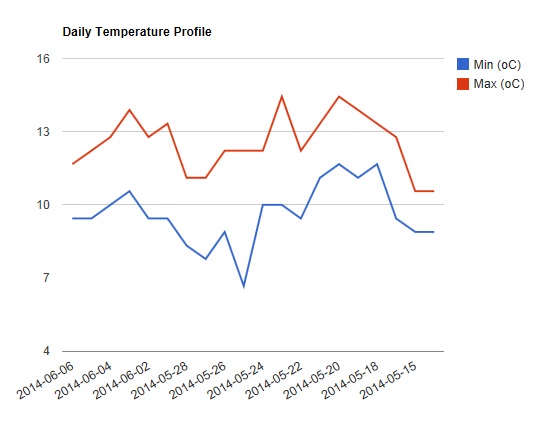
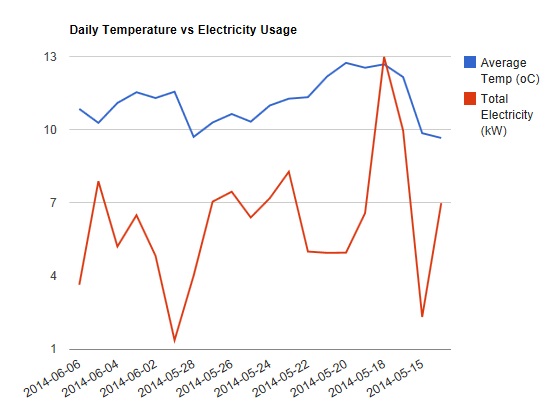
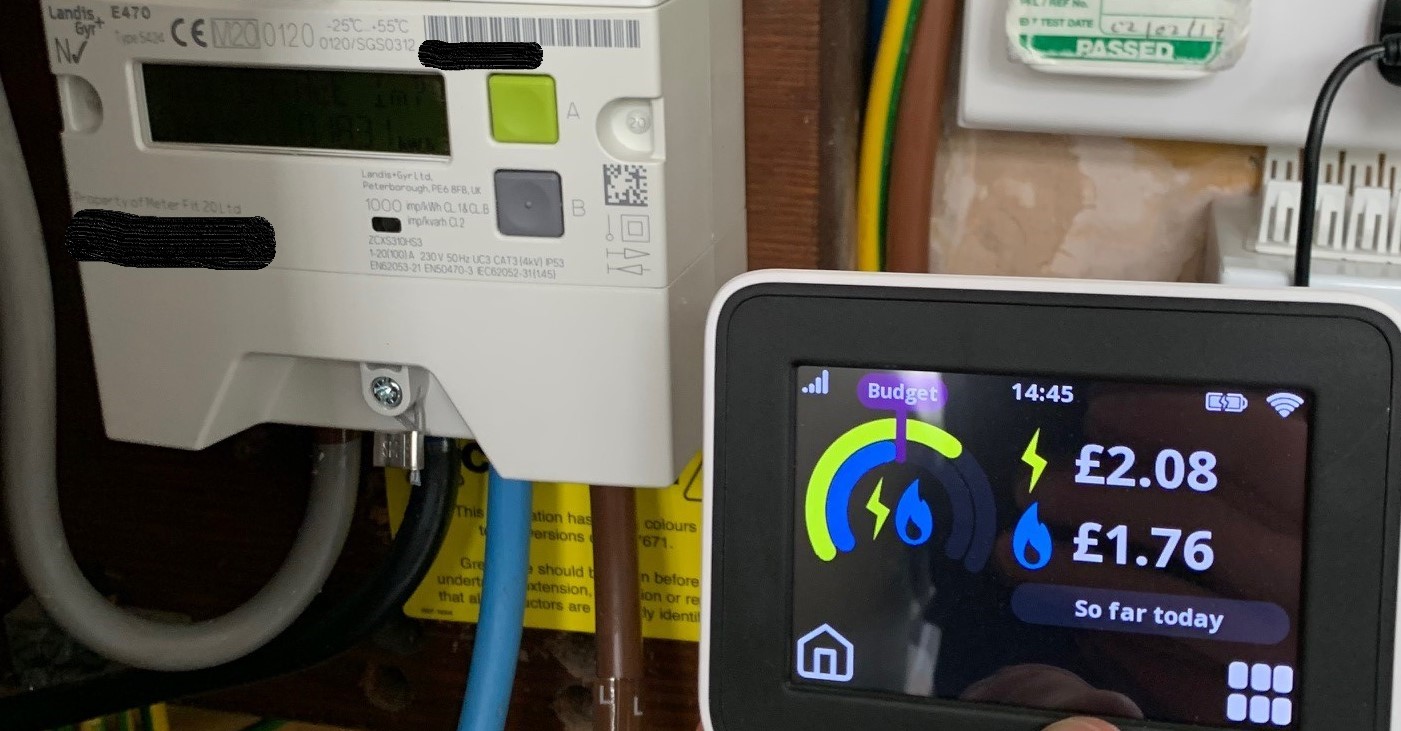
Since first publishing this page in Nov 2017 I have now had a Landis+Gyr E470 smart meter installed. This is connected to SmartThings.com via Bulb green energy tariff. Hence I can access Gas and Electricity readings via the SmartThings API and now longer need to count the flashes on my previous meter. I am also recording the temperature in Cambridge every 30 minutes. These recording appear in this graph.
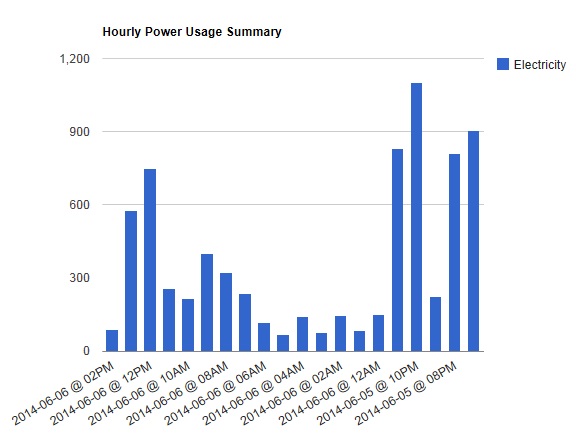
The data collected by the home-energy-monitor has been used to produce the following graphs.
 |
 |
 |
 |
Example calculations on the dashboard:
- Electricity Consumption = 13.5740 kWh
- Electricity Meter Reading = 35769.574 kWh (Predicted)
- Electricity Cost = £1.41
- Average Electricity Consumption = 9.9882 kWh
- CO2 = 7.07395436 Kg
- CH4 = 0.0033935 Kg
- N2O = 0.04384402 Kg
- Total Direct GHG = 7.12119188 Kg
- Radioactivity = 0.0230758 g
- Gas Consumption = 0 kWh
- Gas Meter Reading = 3366 kWh (Predicted)
- Gas Cost = £0
- Water Consumption = 0 m3
- Water Meter Reading = 1 m3 (Predicted)
- Water Cost = £0
- Total Cost = £1.41
Data Collected from Home-Energy-Monitor
I have been logging my electricity usage for 351 days with the Home-Energy-Monitor design provided on this website. 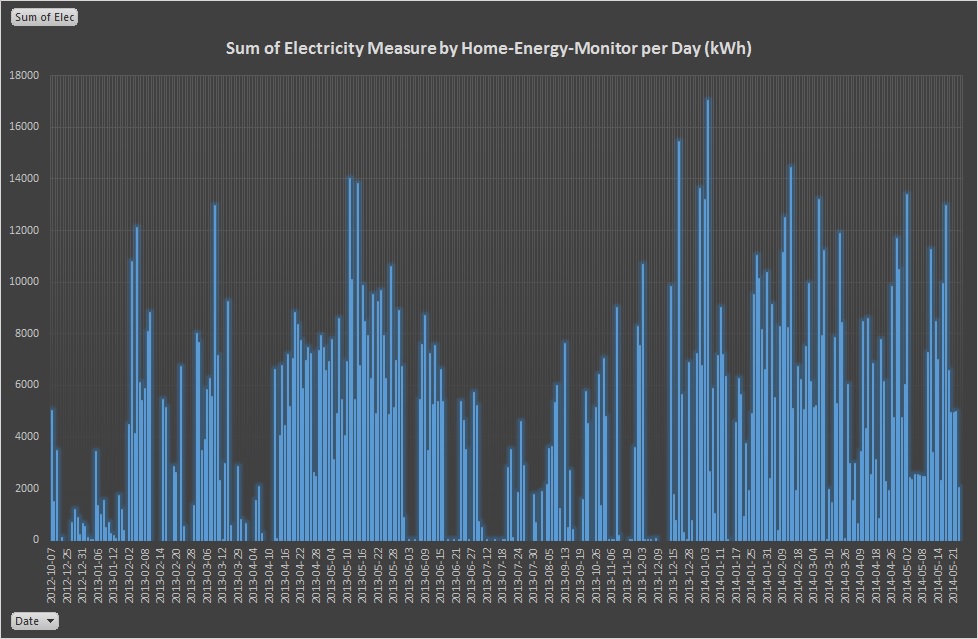
Extended Test
The prototype energy monitor is connected to my electricity meter. The meter is located in the cupboard under the stairs, so the light on the photo diode only comes from the flashing LED on the meter. I have measured the ADC values when the:
- Cupboard door is closed = 1
- Cupboard door is open in day lights = 12
- Meter light flashes > 21
I have set the ADC threshold for counting LED flashes at 20 and started a 5 days trial to compare the energy monitor and the meter.
First PCB Assembled
Soldered my first PCB and connected the Wifly and PICAXE. Powers up OK via the USB adapter.
The printed circuit boards from PCB pool have arrived and look good. No solder resist or silkscreen for these prototypes, but the production version would have these.
")
Collecting Data
Started collecting data from my prototype energy monitor today. So far it logs:
- Temperature
- Battery Voltage
- Electricity usage
I am using Google Guages and Chart to display the data.
The PCB is layed out and on order. This will be the first production prototype with pcb-pool
Next PCB Layout
Added some 1nF capacitors to the regulator and the wifly power is much smoother. Now running the wifly connected to the PIXAXE 08-M2 to prototype the final design before laying out the little PCB that will hold the phototransistor, PICAXE and wifly next to the electricity meter LED.
Power Supply Filtering
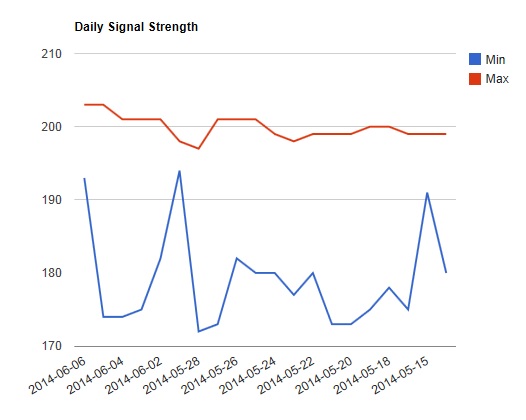
I wanted to investigate whether I needed to fit filtering capacitors to 3.3V regulator attached to the 5V USB power supply. Although ceramic filtering capacitors are low cost, they do represent a significant PCB area in my design. However the graph below shows the 3.3V board supply as measured by the WiFly module over a 10 hour period. 
It is assumed that the 14 bit ADC is used (0 -4096) to represent WiFly max voltage of 3.6V. Hence the:
- Average of 2964 = 2.61V
- Max of 2980 = 2.62
- Min of 2841 = 2.50V
These figures need to confirmed by multimeter as when powered from 3 AA batteries (1.2V each) the average Wifly reading was 3022 = 2.65V. So it looks like a 1V off set appears on the Wifly readings.
USB 2.0 Power Specification
I was interested to discover if smoothing capacitors are required by my design when using a USB power adapter. So I looked at the USB 2.0 specification on http://www.usb.org/developers/docs
- Power Output 5V ± 0.25V @ 500mA Max
- Typical ± 60mV ripple @ 50Hz
In conclusion will need capacitors around the regulator to remove the ripple produced by the USB power supply.
Switching to mains power
Making the switch to mains power for this project. The circuit will now be powered by a 110-240V USB adapter (e.g. Apple MB706B/A). With a male USB plug on the end of the monitor providing a 5Vdc supply to the PCB which will be regulated to 3.6Vdc for the WiFly RN-XV and the PICAXE.

The monitor will stick onto the front of the electricity meter (see figure above) and count the LED pulses with a phototransistor mounted on the back of the PCB.
What to do about batteries
I am currently using 4 AA Duracell rechargable batteries in the prototype unit. This is because I expect the power consumption to be:
- WiFly RN-XV = 240mA
- PICAXE = 5mA
The WiFly transmits for 1 second every 60 seconds and the PICAXE is powered continually.
Therefore power consumption = 5 + (240 / 3600) = 5.6mAh
However is this the Ok for the final version, the options are:
- Duracell CR2 battery, weighs 11g, cylinder 27×15.6mm. Outputs 3.2-3.3v with current capacity of 800 milliamp-hours. £2.20 each @ Amazon. Hence 142 hours (6 days) operation.
- Duracell CR2032, 3V Lithium, 220mAh, £0.60 each @ Amazon (5 pack). Hence 39 hours (1.6 days) operation.
- Duracell rechargeable AA, 3 x 1.2V, 2450mAh, £4.38 @ Amazon (4 pack). Hence 437 hours (18 days) operation.
- Duracell AA, 3 x 1.5V, 1500mAh, £1.20 @ Amazon (20 pack). Hence 267 hours (11 days) operation.
I am currently running the prototype to check these assumptions, then will need to look at ways to reduce the power consumption of the PICAXE to increase battery life.
Running with a 2 minutes update rate instead of 60 seconds, 4 rechargeable 2450mAh batteries lasted 57 hrs. That is 42mAh, hence 10.3W so running on the mains is my only option.
Prototype system is now up and running. It logs my electricity usage, by counting LED flashes on my meter. and sending the count to this website every 40 seconds via WiFi.

This product is being designed in Britain to be manufactured in the UK. Component parts will be ethically sourced and comply to the EU legislation (e.g. RoHS).
Testing
Testing various different types of optical sensors to determine which is best at detecting the LED pulse from my electricity meter.
- Optical Transistor (TCRT5000)

- Photo Reflector Sensor (SY-CR102)

- Phototransistor (OFT-3301)


Recycling…
What can you do with a bottle top? A 7UP bottle top proves to be a great shroud for the optical sensors being tested. A small cut in one side to allow the cable to pass through and a peice of white tack to hold the sensor mounted on breadboard. Perfect.

Uses for an Energy Monitor
I was thinking about how you might use an energy monitor:
- Reduce consumption of electricity, water and gas by analysis of monthly usage to change routine e.g. reduce shower times to 3 minutes, avoid standby mode on TV, timer switch for broadband router.
- Confirm appliances are switched off once you have left home e.g. remote meter reading to confirm lights, oven and taps are off.
- Checking how much each appliance uses to consider alternatives e.g. water used per toilet flush, gas used by boiler to heat house, electricity used by TV+sky box.
- Predict your utility bills e.g. know much you are using daily so you can stay within your household budget.
- Understand your carbon footprint e.g. keep a record of you emissions so you can offset them or know you are doing your bit to reduce your environmental impact.
As well as being designed and manufactured in Britain, I believe that the energy monitor itself should be environmentally friendly i.e. minimal packaging, shipping, materials and that it should be lead free.
Prototype Schematic and PCB


I selected my critical processing components as the:
- PICAXE-08M2
- PN-XV WiFly Module
| Quantity | Name | Supplier | Part # | Link |
| 3 | 20K carbon film 0.25W 5% resistor | Farnell | 1416788 | LINK |
| 1 | 12way 5mm Terminal Block | Farnell | 2008003 | LINK |
| 1 | RN-XV WiFly Module | Sparkfun | WRL-10822 | LINK |
| 1 | PICAXE-08M2 | Sparkfun | COM-10803 | LINK |
| 1 | 3.3V Voltage Regulator MCP1702 | Farnell | 1331485 | LINK |
| 3 | Reflective Sensor | Farnell | 1470066 | LINK |
| 1 | 3AA Battery Box | Farnell | 1650682 | LINK |
| 1 | PCB 55x60mm 2Layer PTH FR4 1ozCu Au/Ni | PCB Train | ||
| 2 | 1uF ceramic capacitor | Farnell | 1600879 | LINK |
| 1 | Solder wire, 60/40 1mm 44m | Farnell | 453584 | LINK |
| 1 | Enclosure, plastic, 3.15″x1.58″x0.59″ | Farnell | 1876034 | LINK |
| 3 | Duracell non-rechargable AA Battery | Amazon | ||
| 3 | 1m Sensor cables (30.5m reel) | Farnell | 1182120 | LINK |
Data Logger
It was necessary to collect data from the sensor to determine threshold values for pulse detection. The data would also prove the concept of detecting infrared light reflected/emitted from the electricity, water and gas meters.
;=================================
; 10bit Logger PICAXE Programme
; By Mark Harris in June 2012
;=================================#picaxe 28×2
#no_tablemain:
high C.0 ; switch on LED output C.0
start:
readadc10 3, w1 ; read 10 bit adc 3 into variable w1
sertxd(#w1,13,10) ; transmit on serial port
goto start ; loop back to start
With the PICAXE running this is what I plotted in Excel

The conclusion drawn from this data are:
- White Test Card – the opto reflective sensor works really well with the test card, there are clear peaks and troughs as the card it placed over the sensor and removed. However the signal drops as the card is placed rather than increasing due to the card reflecting more light. This appears to show that the IR emitter (LED) was not working and the white card in in fact blocking the IR in the sunlight
- Water – flat line traces, poor results. There is no sun light in the man-hour were the water meter is located, therefore if the IR emitter was not working then there would be sunlight to reflect off the moving dial to prove the pulses. This test will need to be repeated.
- Gas – one clear pulse detected when the door of the gas meter was opened so the sunlight could reflect off the silver dial. Repeat test with IR emitter working.
- Electricity – no IR emitter required for this test at the electricity meter proves a pulsing LED of its own. However the LED does not produce much light in the wavelengths that the phototransistor is sensitive since the pulse heights are very small and insufficient to detect against the background noise. Suggest changing to a move sensitivity photo transistor and repeating the test.
- Electricity
Water Meter
The Kent V120 water meter comes with an “encoder register” which can be accessed by Elster’s non-contact inductive T450 reader, through an unobtrusive T230 electronic pitscan pad. However the pitscan contains an anti-tamper device that will detect a wire cut, hence let the water company know I have connected another device to their meter.
Instead of tapping off the inductive pitscan on the water meter I am going to try the Photo Reflector Sensor SY-CR102 @ £0.99 each from Maplin. The sensor has the following specification 
Photo Emitter (LED)
- IF = 20mA
- ICE = 1mA
- VCE = 5V
Photo Sensor (transistor)
- Photocurrent (RL=20k) = 230µa min.
- Saturation (RL=20k) = 0.4V
- Cross talk = 1.0µA
- Dark current (IF=0mA) = 100nA
- VF = 1.7V
- VECO (ICE=1mA) = -3V
- VCEO (ICE=1mA) = 12V
- Rise time = 1ms
- Fall time = 1ms
Gas Sensor
The Itron U6 “pulse ready” meter has an  opto-reflective silvered zero ready to accept a photo reflective sensor. Photo-reflective IR sensors on veroboard can be pushed onto a couple of locating pegs, or white tacked for development, as in the photo!
The 4 wires are: LED supply, photo transistor supply, photo transistor output and ground. I could have used an additional NPN transistor to buffer the voltage output and give me a bit more gain and sensitivity. This was connected to the 10bit ADC on a PICAXE 20X2.
A routine to print the ADC values to the serial port at baud rate of 9600 was written to see what was coming out of the sensor.
Once plotted in Excel you could see that there was a very characteristic voltage pulse produced when the zero went past the sensor.
Taking pulse count every 6 minutes you can see when the gas is being used. Each pulse on the meter represents passing 10 litres of gas. Gas is about 39MJ/m3 so by dividing 390,000 by the time between consecutive pulses,
you get the instantaneous boiler power in kilowatts. Exact conversion figures from gas units to kilowatt hours for imperial meters are as follows:
- Multiply your units used by 2.83 to give you the number of cubic metres of gas used. (If you have a newer metric meter measuring gas in cubic metres you do not need to do this).
- Multiply by the temperature and pressure figure (1.02264).
- Multiply by colorific value (39.25)Divide by 3.6 to get the number of kilowatt hours (kWh)
Current Sensor
The OWL TSE000-001 standard sensor fit cables up to 10mm diameter (0.4 inch) that’s a circumference of 31.5mm (1.25 inches) and will handle loads up to 71 amps. Coil resistance is 81.4ohms. 3.5m m jack 2pole.
Domestic supply tends to peak at 6kW, so a 7kW capable design will account for growth in consumption. Average UK consumption is 5kW per day (20kW in Norway).
The output at the sensor plug is 350mVrms at 2.5kW i.e. 350×1.414×2.8 = 1386mVpk at 7kW. Cost £6.95 from Amazon.
System Block Diagram
In order to work out the features and flow of information required to take the measurements I prepared a system block diagram. This does not show components, but the functions required to measure voltage, current, gas and water consumption.

Legislation
In December 2009 the United Kingdom’s Department of Energy and Climate Change announced its intention to have smart meters in all homes by 2020. As of January 2010 there were estimated to be in excess of 170,000 domestic smart meters installed. The English Housing Survey 2010-2011 reported 21,892,679 homes in the UK. If 1% of UK homes without a smart meter bought an energy monitor then 217,226 monitors would be sold in the next 8 years.
Research
It was necessary to research the meter technologies used for the initial testing to determine potential measurement methods. The data sheets can be found below.
From the data sheets potential measurement techniques include:
- Optical pulse counting from reflective or light emitting sources
- Magnetic pickup of moving mechanical parts
- Reading existing data buses via inductive sensors
Also today I started looking at potential technologies / components to use in the design. The data sheets are listed below:
- WiFly-RN-XV Datasheet
- WiFly 2.32-v1.0r User Manual
- Enclosure 1551FFL
- Reflective Optical Senor
- LM520A LED
- LD1117V33 Voltage Reg
Measurement Flow Chart
Each measurement (i.e. voltage, current, temperature, gas, water) will require the following steps.

The exact sensors will depend on the methods used to detect change:
- Voltage – 240Vac 50Hz mains transformer coupled lower 3.7Vac 50Hz for measurement
- Current – clamp transformer
- Temperature – thermistor
- Gas – photodiode
- Water – magnetic pulse
Similar Products Already on the Market
A comparision of 8 popular energy monitors reveals both the target price and the features the consumer expects.
| Manufacturer | Owl | Eco-eye | Efergy | Current Cost | Eco | Target | |||
| Model | CM119 | CM130 | Elite | Mini | E2 | Elite | CC128 | Elite200 | |
| RRP Price | £34.95 | £24.95 | £49.95 | £39.95 | £49.95 | £39.95 | £39.95 | £89.95 | £35 |
| Portable display | x | x | x | x | x | x | x | x | |
| Up to 30m indoor range | x | x | x | x | x | x | x | x | |
| Easy to connect | x | x | x | x | x | x | x | x | x |
| Easy to read display | x | x | x | x | x | x | x | x | |
| Connection to PC | x | x | x | x | x | x | x | ||
| Connect to PC included | x | Data set | x | ||||||
| Analysis software included | x | x | |||||||
| Analysis software available | x | x | x | x | x | x | |||
| Tri phase compatible | x | x | x | x | x | x | x | x | |
| Max Amps input rating (phase) | 71 | 71 | 80 | 80 | 95 | 95 | 90 | 200 | 71 |
| Country of manufacture | China | China | UK | UK | China | China | China | UK | UK |
| Economy 7 compatible | x | x | x | x | |||||
| Transmitter battery life | 18m | 18m | 12m | 12m | 12m | 12m | 84m | 12m | |
| Transmitter sample rates | 6, 60 | 6, sec | 4 sec | 4 sec | 6 sec | 6 sec | 6 sec | 4 sec | 6 secs |
| Manufacturer stated accuracy | 2% | 2% | <8% | <8% | <2% | ||||
| Batteries included | x | x | x | x | x | x | |||
| DC Adapter input | x | x | x | x | x | x | x | ||
| DC Adapter included | x | ||||||||
| Instant kWh view | x | x | x | x | x | x | x | ||
| Instant pence per hour view | x | x | x | x | x | x | x | x | |
| Kg C02 per hour view | x | x | x | x | x | x | x | ||
| Tonnes CO2 per year | x | month | month | month | x | ||||
| Projected cost per year | x | x | x | x | |||||
| Memory function | x | x | x | x | x | x | x | x | |
| Cost per KW for current hour | x | x | x | x | x | x | |||
| Data storage capacity | 12m | 32m | 32m | 32m | 24m | 24m | 96m | 32m | 52m |
| Date/time display | x | clock | clock | clock | clock | x | clock | ||
| Temperature | x | x | x | x | x | x | |||
A more comprehensive listing is available at http://www.electricity-monitor.com/energy-monitor-comparison-chart-i-26.html
In the beginning..
 This site has been setup to track the development of an energy monitoring system that will analyse domestic consumption of electricity, gas and water.
The project is being completed as part of an electronics course I am taking at Cambridge Regional College.
System inputs
- Gas Meter – Itron (1 pulse = 10dm3)
- Electricity Meter – Ampy Automation (1000 pulses = 1 kWh)
- Water Meter – ABB/Kent
System outputs
- Latest real power, apparent power and power factor
- Logged voltage, current, frequency and THD
- Graphed consumption of electricity, gas and water
- Emissions (greenhouse gas and radioactivity)
- Costs (based on tariff)
The development will last 6 weeks and cost less than £200. Target unit price will be £50.
